
December 20, 2023
Google Tag Manager vs Page Speed: The Impact and How to Improve
Updated: December 20th, 2023
One of the main selling points of Google Tag Manager to marketers (that you can notice even on their landing page) is that it optimizes page speed or pages can load faster. But is that really true? Does GTM (or any other tag management solution) really give wings to your website?
The short answer is: it depends.
Once in a while, I notice forum threads and chats online where people (usually digital marketers) have received complaints from their IT departments (that GTM slows the website down), and they are looking for some tips on how to improve page speed.
While I know the main best practices for running a GTM on your site, I realized there are still some gaps in my knowledge regarding GTM vs. page performance.
What exactly and how does GTM (and various tags) affect page speed? This question was stuck in my head for quite some time, and very recently, I decided to run a bunch of tests with various GTM setups to experience the effects myself.
Special thanks go to Simo Ahava. While writing this blog post (and collecting data), I reached out to him because I had some doubts surrounding this article (and whether I am not missing something). As always, he was kind to give some tips and ideas. Some of them were a-ha! moments for me, others raised even more questions that required further investigation.
But in the end, I’m happy with the new knowledge I gained from this long process of research. Hopefully, you’ll find something useful too.

Table of contents
Here’s what you will learn in this article
- Quick summary
- Part #1. How were my tests conducted?
- Part #2: Results and Insights
- Part #3: Tips on how to minimize GTM’s impact on page speed
- #1. Regularly audit your container and look for abandoned vendors
- #2. Delay tags that are less important
- #3. Maybe some tags can be fired only on certain pages?
- #4. Try avoiding heavy DOM manipulations
- #5. Server-side tracking with Google Tag Manager
- #6. Test the page speed by yourself after you make changes
- #7. Always try to keep your container lean
- Final words
Disclaimer
You should read this guide and take my findings with a grain of salt. Do not accept everything as absolute truth. Regarding page speed and website performance, many nuances affect the results, and I did not cover all of them. I think that I was scratching the surface.
Nevertheless, my findings may be a good starting point and reference for those who are not familiar with page speed optimization at all and are just starting.
Quick summary for those who are in a hurry (TL;DR)
This guide is a lengthy one. If you have time, I definitely recommend reading it from start to finish.
If you only have a couple more minutes, then here’s what you should know:
- Even asynchronous tags impact the website’s loading speed.
- An empty GTM container had a minimal impact on page speed. The biggest offenders can be tags that you add to that container. But every tag is different, and the impact can vary. Therefore, the final result is “It depends”.
- 8 tracking tags I used in some tests had a more negative impact while being hardcoded in the <head> vs. 8 tags implemented via GTM. But that is not categorically true for every case.
- The later you fire tags, the less of a negative impact they can have (unless you load a bunch of Custom HTML tags in a Single Page Application. Then the impact can be felt even after the initial page load. Note: in this guide, I focused on the initial page load only.)
- Be careful with DOM manipulations. They require browser resources and in one of my experiments, they added 3 seconds to the Time to Interactive metric.
- Server-side tagging can improve the page performance
- Remove unnecessary (or irrelevant) items in your container. This will make your work with the tag manager easier and can potentially improve page speed (although that isn’t always the case).
And if you have more time, then let’s dive deeper, and I’ll show you what I’ve learned.
Part #1. How were my tests conducted?
Let’s start by explaining my methods and setup. If you don’t care about the setup, skip to chapter 2 of this blog post, where I review my findings.
The setup
To measure page speed timings, I used webpagetest.org and the built-in site speed auditing tool, Lighthouse, in Chrome’s developer console (after you open the dev tools, go to the Audits tab).
In webpagetest.org, I was using:
- Ireland (EC2, Chrome, Firefox) as a test location (for Desktop), Oneplus 5 device (for Mobile testing)
- 3G Fast and 3G Slow for connection
- There were 3 tests in every run
- Other settings were the default
In Lighthouse, I was using both mobile and desktop reporting (as there aren’t many settings).
To isolate the possible impact of Chrome extensions on test results, I was using it as a Guest. This means that no browser extensions were present. The laptop’s performance was set to maximum.

Metrics
To measure the impact, I checked the following metrics.
Webpagetest.org:
- Document complete (in seconds). It shows when website static content (like images) has loaded. This usually happens after all of the images have loaded but may not include content that is triggered by javascript execution. The more seconds it takes to load fully, the worse it is.
- Fully loaded (in seconds). This is the point after onLoad where network activity has stopped for 2 seconds (usually, any activity out here is from javascript on the page doing something dynamically. The more seconds it takes to load fully, the worse it is.
Lighthouse (Chrome’s built-in site audit tool):
- First meaningful paint (in seconds). It measures the time in seconds between the user initiating the page load and the page rendering the primary above-the-fold content (learn more). The more seconds it takes to load fully, the worse it is.
- Time to interactive (in seconds). It measures how long it takes a page to become fully interactive (learn more). A page is considered fully interactive when:
- The page displays useful content
- The page responds to user interactions within 50 milliseconds
- First CPU idle (in seconds). It measures how long it takes a page to become minimally interactive (when most UI elements on the screen respond to user input in a reasonable amount of time). Learn more.
- Max potential First Input Delay (FID) (in milliseconds). It measures the potential time from when a user first interacts with your site (i.e. when they click a link) to the time when the browser is actually able to respond to that interaction. If for example, the browser reacts to your click only after 1 second, then FID’s value is 1000. Learn more.
Tracking codes
Here are the tracking codes that I used in some of my experiments:
- Google Analytics pageview tag (gtag.js)
- Facebook pixel main code (that tracks a page view)
- Reddit Pixel conversion tag
- Quora pixel (that tracks a page view)
- LinkedIn Insights tag
- Twitter Universal Tag (tracks page view)
- Google Ads remarketing tag (gtag.js)
- Hotjar main tracking code
What kind of tests did I run?
Here is the list of all the tests I ran. I measured page speed with the aforementioned two tools in the following situations:
- The page has no 3rd-party tracking codes and no tag management solution
- The page has hardcoded 3rd party tracking codes (before the closing <head> tag) and no tag management solution. “Hardcoded” means that the tags were added directly to the website’s source code.
- The page has an empty GTM container (and no hardcoded tags)
- All 8 tracking tags are implemented via GTM, fire on All Pages trigger (a.k.a. gtm.js)
- All tags are implemented via GTM, fire on DOM Ready trigger (a.k.a. gtm.dom)
- All tags are implemented via GTM, fire on Window Loaded trigger (a.k.a. gtm.load)
- All tags are implemented via GTM, fire 1.5 seconds after the Window Loaded trigger (the idea of this custom solution was borrowed from Pavel Brecik)
- A GTM container with 100 Custom HTML tags (all use the same simple script). Tracking tags were removed from the container. No further tests included tracking tags.
<script> console.log('hello'); </script> - A GTM container with 100 Custom HTML tags (all use the same simple script that also adds additional elements to the bottom of the page body).
<script> console.log('Hello!'); </script> <div> <span>Hello!</span> </div> - A GTM container with 200 Custom HTML tags (all use the same simple script as the previous experiment).
- A GTM container with 100 Custom HTML tags that insert an element after Heading 2. Every tag contained this script (borrowed from here):
<script> (function() { var h3 = document.createElement('h3'); h3.innerText = "An additional element"; var title = document.querySelector('h2'); if (title) { title.parentElement.insertBefore(h3, title.nextSibling); } })(); </script> - A GTM container with 100 Custom HTML tags that insert an element after the 21st link on a page. This requires the browser to iterate through more elements on a page thus requires more resources. Every tag contained this script:
<script> (function() { var h3 = document.createElement('h3'); h3.innerText = "An additional element"; var element = document.querySelectorAll('a')[20]; if (element) { element.parentElement.insertBefore(h3, element.nextSibling); } })(); </script> - Full GTM container with static content (this means that it reached 100% of its maximum capacity (200kb)). But I wanted to address only the size of it and isolate some potentially expensive tasks for the browser, therefore, I created a container full of Constant Variables only (each contained ~1000 characters). Curious how many variables like this fit into a single GTM container? In my case, the number was 1976.
I conducted each test at least 3 times and then calculated the average time.
P.S. these tests were in the early 2020s, when Google Tag Manager did not have the “Consent initialization” and “Initialization” triggers.
What I mean by saying “Page Speed”
Every time I mention page speed in this blog post, I focus on a page performance that is related to the initial page load, not what is happening after that. But don’t think that there is no impact on the performance after all the resources have been loaded.
Quite the opposite. And that is especially important for Single Page Applications when GTM can add additional nodes to the page document thus requiring additional computer resources to process everything.
Simo mentions this issue in multiple blog posts, for example, this and this one.
Part #2: Results and Insights
If you want to check more detailed timing data of each experiment, you can check this spreadsheet. And here are some key takeaways that I want to point out. Most of them are delivered to you by Captain Obvious (while others might teach you something new).
Asynchronous does not mean there is no impact on page speed
First, let’s quickly get familiar with synchronous and asynchronous scripts. Synchronous script means that the browser will not load further resources of the website (e.g. images, etc.) until that synchronous script is loaded. This can greatly impact the performance of the website and user experience.
Imagine having a bunch of synchronous scripts on a page that block the page rendering for 15 seconds, and all you see is just a white screen.
Asynchronous scripts, on the other hand, are loaded concurrently with other web page components. This means that while the script is being loaded, the main page content is also loaded and isn’t blocked.
Sounds amazing. You can load your tracking codes without having any effect website’s image and content loading, right? Well, not really.
Even though the elements are not blocked directly, asynchronous scripts still require computer resources meaning that the execution of the website’s main files/scripts slows down.
Here are a few examples to prove this point:
- The website’s Document Loaded event happened in 4 seconds when no tags were implemented (Cell B5 in this sheet)
- That number increased to 7.7 seconds when a bunch of tags was added to the <head> (Cell B7)

“Document complete” event timings (in seconds). No tags vs 8 hardcoded tags (in website’s <head>)
Even adding an empty Google Tag Manager container slightly increased the page loading time (cells B6-E6) by ~0.1 sec.
![]()
![]()
It’s not GTM itself. It’s what you put inside of it
In my experiments (and I conducted the same test multiple times), an empty GTM container added to a website caused a very minimal delay, ~100 milliseconds (sometimes even no visible delay). That’s because you just added one script to a page.
The impact on a website’s page speed starts when you add additional items to the container. However, all items are not equal. It really depends on what those items (e.g., tags or variables) do. For example, when I added 8 tracking tags to the container, page speed slowed down by ~3 seconds on Fast 3G (Cells B8-C8) and by ~10 seconds on Slow 3G (Cells D8-E8).

“Document complete” event timings (in seconds). No tags vs. 8 tracking tags in GTM
However, if you think that just by adding several items to the container, the site always significantly slows down, that is not the case. In another experiment, I had only 1976 constant variables (the container then reached a 200kb size limit), and the page loading time increased just by 0.1-0.3 seconds (Cells B17-E17).
Those variables were not invoking complex functions, were not loading scripts, or adding/manipulating website elements. Therefore, their impact was not as visible as with 8 tags (GA, FB Pixel, Twitter tag, etc.).
“Wait a minute“, you might be thinking, “Just 8 tags slowed down the website by that much? I thought GTM was supposed to optimize page loading speed“. Continue reading.
Hardcoded tags (in <head> slowed down the website more (compared to GTM + those tags)
You should not expect from GTM some magical solution that helps your website to load instantly. If you add those very same 8 scripts (I used in the previous example) directly to the website’s source code, the results will probably be even worse. Because as I’ve said before, it’s not GTM itself that slows your website down, it’s what you put inside of it.
And that’s exactly what happened in my experiments.
When I added 8 tracking scripts directly to the site’s code (before the closed </head> tag), the page slowed down even more. Instead of 3 seconds increase in the page load timing, hardcoded tags added 600 milliseconds on a fast 3G connection (cell B7-C7).

“Document complete” event timings (in seconds). No tags vs 8 hardcoded tracking tags vs 8 tracking tags in GTM
At least based on my experiment, GTM does indeed help sites load a bit faster (compared to the test where the same tags were hardcoded).

“Document complete” event timings (in seconds). No tags vs 8 hardcoded tracking tags vs 8 tracking tags in GTM
But this is NOT categorically true in every case. When I mentioned this result and my conclusion to Simo, he said that there are cases where it is totally possible to run the JS itself on the site without GTM in a way that is much more optimal than by using GTM. Therefore, this is one of those cases where you can take my findings with a grain of salt.
Go ahead and test it by yourself. Maybe you’ll discover something interesting.
The moment when a tag fires matters
The later you do that, the better. This is also covered and explained in Pavel Brecik’s guide. The main point here is that the later you activate your tag, the lesser impact will on page load speed.
I took those very same 8 tags (FB Pixel, etc.) and fired all of them at different moments. You are probably already familiar with 3 page-view-related triggers, Page view (gtm.js), DOM Ready (gtm.dom), Window Loaded (gtm.load). So, I fired those 8 tags on these three different moments (e.g., one experiment included all 8 tags firing on Pageview, then in the next experiment, I used DOM Ready, etc.).
Additionally, I borrowed Pavel’s tip and added the 4th moment when the tag can be fired — 1.5 seconds after Window Loaded.
By the way, here’s the code that was used by Pavel:
<script>
  (function() {
    try {
      window.setTimeout(function(){
        dataLayer.push({
          'event' : 'afterLoad'
        });
      }, 1500);
    } catch (err) {}
  })();
</script>
The result?
While firing tags on DOM Ready or Window Loaded reduced page loading time just a bit, the most significant improvement was seen with afterLoad event. It means that my tags were fired only when other web page components were already loaded, therefore, they did not affect the initial loading process.

“Fully loaded” event timings (in seconds). “Pageview” vs “DOM Ready” vs “Window Loaded” vs “afterLoad” triggers
Why is delaying tags good in the first place? Because a website might have some components/elements that are loaded on a page dynamically only after all the resources (including scripts) are loaded. If, due to your tags, a page loads slower, this means that those (possibly important) website elements will also load later than expected.
So, if you delay some tags and fire them AFTER all other resources have been loaded, you are not delaying the appearance of those other components that much.
However, keep in mind that if you delay tracking tags that you require precision from (e.g., Google Analytics), such a delay will cause more inaccuracy in your reports. Why? Because some visitors will not even wait for your website to fully load (if it takes too much time) and will leave the site before you even fire GA.
The end result? Your reports will not even know that visitor X has ever been on your site.
If delaying tags sounds like a solution for you, don’t rush to implement this right away. First, you should discuss with your team/company what tags are less critical and can be delayed. Everyone involved must be on board. A unilateral decision might cause an unexpected loss of data or even revenue.
Tracking tags are not the only offenders
Another group of tags that affect page speed (while loading) is the ones that manipulate the Document Object Model (DOM) (e.g., edit or add new elements to the page).
However, just like with anything else in this guide, the scale of impact on page speed depends on various factors. In experiments #10-#13, I tried several variations:
- Adding elements without specifying the location (this means that they will be added to the bottom of the page)
- Adding elements to a specific part of the page (this means that a script must check the page and find the right spot (this automatically requires more resources)).
Obviously, I took things possibly a bit too far (by using 100-200 Custom HTML tags that add elements), but at the same time, the “heaviness” of those tags was low.
Nevertheless, when your tag must insert an element to a certain part of the page, it will require more computer resources. If your script, for example, uses a document.querySelectorAll (meaning that it searches for all elements on a page that meet certain criteria), and iterating through every element, will require even more time/resources from your browser.
In experiments #10 and #11, I did not specify where to add elements. Therefore, GTM inserted them at the end of <body>. This did not show a significant impact on page loading speed.
In experiment #12, I specified where I wanted to inject new elements. I wasn’t using the querySelectorAll method. But even without that, 100 same tags (that added elements to a particular part of the page) added several hundreds of milliseconds to page loading time. And the script that I used was fairly basic:
<script>
  (function() {
    var h3 = document.createElement('h3');

    h3.innerText = "An additional element";

    var title = document.querySelector('h2');
    if (title) {
      title.parentElement.insertBefore(h3, title.nextSibling);
    }
  })();
</script>
Here’s the impact:
“Fully loaded” event timings (in seconds). Empty GTM container vs 100 Custom HTML tags that do a basic DOM manipulation
Experiment #13 was built as a bit more resource-demanding. I had 100 Custom HTML tags that were looking for all links on a page, and then after the 21st element, it would add a Heading 3 with some sample text.
<script>
  (function() {
    var h3 = document.createElement('h3');

    h3.innerText = "An additional element";

    var element = document.querySelectorAll('a')[20];
    if (element) {
      element.parentElement.insertBefore(h3, element.nextSibling);
    }
  })();
</script>
The difference between this and #12 experiment is that this one is iterating through website elements, checking every one of them and then adds an element if the criterion is met. Although the results on webpagetest.org where not groundbreaking (there was a slight delay added to the page load (100-200ms), things got more interesting with Lighthouse (built-in Chrome site audit tool).
Both on Desktop and Mobile, those tags added 2-3 seconds to the Time to Interactive metric meaning that during the page load, a browser is pretty busy adding those Heading 3 elements to a page, therefore, the site might be unresponsive to a visitor for a longer time.

“Time to interactive” (in seconds) when a bit heavier DOM manipulation is in place
Of course, I’m taking this a bit too far by adding the same script 100 times but this is just a proof of concept. Maybe your container will have fewer tags that manipulate the DOM, but their impact will be greater (due to their complexity).
Part #3: Tips on how to minimize Google Tag Manager’s impact on page speed
And now, let’s proceed to the part you’re probably most interested in, minimizing the impact.
I hate to break this for you, but there is no silver bullet. There are some possible quick-ish wins but at the same time, you will have to discuss things internally in your team/company and look for compromises (in one area, page speed will be sacrificed, in other — data accuracy).

#1. Regularly audit your container and look for abandoned vendors
I remember hearing in one of the presentations from the 2019 MeasureCamp in London (I believe that was Andy Davies, but not 100% sure) that some audits revealed that ~30% of tracking codes (still being loaded on a page) belonged to vendors that were not used by the company anymore.
Imagine this: you migrate from analytics tool X to a new tool Y. But the codes of tool X were still being activated. Let alone the fact that a site is still sending (possibly personal) data to a 3rd party, those tags also affect the page speed.
Identifying such tracking codes (especially in large GTM containers) can be a fairly quick win to improve page speed.
- If you’re not confident how to check the scripts yourself, ask a developer to give you a list of scripts/HTTP requests that he/she thinks could be avoided.
- Then google the domains of those requests and try to identify which tools do they belong to.
- Furthermore, talk with various departments/colleagues about which tools are still in use.
- After you talk with everyone, see if there are any lonely tools in the list you received from a developer in step #1.
- If the scripts of that tool are implemented via GTM, pause those scripts. Keep them that way, say, for a month and see if anyone is complaining about missing data or whatever. If no complaints arise, completely remove the scripts from GTM.
- If the scripts are not in GTM (or any other tag management solution you’re using), contact a developer and ask to temporarily disable those scripts (e.g., by turning them into comments). If nobody complains about that in a month, ask a developer to completely remove them from the code.
#2. Delay tags that are less important (or require less accuracy)
The fewer tags you fire on All Pages or user-defined Page View trigger, the better page loading times will be (at least based on my experiments).
Now, I completely understand that you won’t be able to do that with all of them, but if you apply this approach to at least some of them, you can possibly expect some improvement in performance.
Based on my tests, delaying the tags to fire on DOM Ready (instead of Pageview) introduced only small improvements. But if you move some of your tags to fire on Window Loaded, page loading times improve more significantly, especially on Slow 3G connections.
However, this applies only to the “Document complete” event in webpagetest.org reports, not “Fully loaded”.
If possible, try delaying some tags even more. Pavel Brecik has described in his blog post a technique where he fires tags 1.5 seconds after a Window Loaded event. First, I’ll briefly explain the setup, then discuss the results.
Step #1: Create a Custom HTML tag with the following code
<script>
  (function() {
   try {
     window.setTimeout(
      function(){
       dataLayer.push({'event' : 'afterLoad'});
      }, 1500);
    } catch (err) {}
  })();
</script>
Step #2: Fire this tag on a user-defined trigger Window Loaded

Step #3: Create a Custom Event trigger for the event afterLoad (case-sensitive)
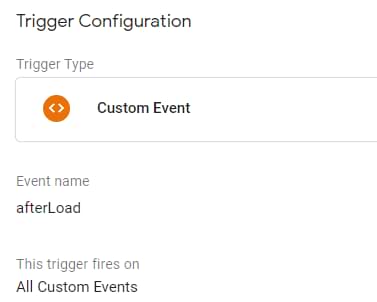
Step #4: Assign this afterLoad Custom Event triggers to those tags that you are willing to delay for 1.5 seconds after the Window Loaded.
And the results were much better if we take a look at Fully Loaded metrics.
“Fully loaded” event timings (in seconds). “Pageview” vs “DOM Ready” vs “Window Loaded” vs “afterLoad” triggers
On a Slow 3G connection, this improvement cut off 6 seconds (while on a fast 3G connection, 600 milliseconds were saved).
How do you decide on which tags can be delayed? Unless you are a one-man band, you do not do that alone. Discuss with your teammates/clients, managers, etc. Every position/opinion must be heard to reach a consensus.

Imagine this:
- If developers decided everything by themselves, they would remove all the marketing tags (or significantly delay them) because they are motivated to optimize performance. But that will negatively affect marketing efforts and, in the bottom line, revenue (if you are, say, heavily investing in online ads).
- If marketers decided everything by themselves, they would probably stuff the website with tens (if not hundreds) of tracking tags, fire them as soon as possible, and therefore destroy the site’s performance. That’s another extreme.
This is why different camps must come to an agreement on how they approach delaying tags, discuss possible implications and decide which tags can be “sacrificed” to be delayed.
For example, if you have implemented a chat widget via GTM (although I think that’s a bad idea and such tools should be implemented directly in the code), I think that widget’s script could definitely be delayed and fired x seconds after the Window Loaded.
Another possible example could be some remarketing tag. Personally, I would like to retarget those people who actually spent some meaningful time on a page. Staying on a page at least till the afterLoad event fires would be a better indicator for retargeting rather than tracking pageview asap. But once again, this is just a suggestion, and you need to decide what’s right for the business.
Just remember one thing: there will be sacrifices. It can be page performance. It can be data accuracy (and possibly revenue). My position here would be not to blindly try to achieve that perfect score (e.g., in Lighthouse, that’s 100) but instead focus on the end result for the business.
It’s all about compromises. With every script that can be added to a site, you (as a GTM user who is adding that script) have to consider the benefit of having that script fire early vs. delaying it (in the name of performance).
First, you must decide what can be delayed within your organization.
#3. Maybe some tags can be fired only on certain pages?
Do you have tags in the container that fire on every page? Do they really have to fire on every page? Maybe you need them just on a set of landing pages but due to lack of time, you chose the “All Pages” trigger?
Try creating more precise triggers that limit tags to just a set of pages, if possible. Then the rest of web pages will not be affected.
#4. Try avoiding heavy DOM manipulations (as a long-term solution)
I mentioned the “long-term solution” in the subtitle for a reason. GTM is an awesome tool to test the proof of concept (e.g. temporarily manipulate certain webpage elements and see if that improved the conversion rate). But once you validate the idea, that improvement should eventually be implemented by a developer and removed from GTM.
A developer will do that in a more optimal way and (probably) without DOM manipulations.
This especially applies to those manipulations that require the browser to iterate through every element and check whether it meets the criteria. Although my experiment #13 did not significantly affect the webpagetest.org results, the Time To Interactive metric was seriously affected (~2-3 seconds were added to the loading time) meaning that the page stays unresponsive for more time.
#5. Server-side tagging with Google Tag Manager
With server-side tagging, you can reduce the number of tracking codes implemented on a website (instead, the heavy lifting can be configured on your server). To get more familiar with this, take a look at this tutorial.
If you are really ready to take this path (because it adds more complexity to your setup), take a look at my intermediate/advanced GTM course where I explain various topics related to your setup, how to optimize it, and how to benefit from SGTM.
#6. Test the page speed by yourself after you make changes in the container
Hopefully, I will introduce the page speed concept as an additional concern to some marketers and analysts and they will be more conscious before adding anything new to the container.
After you publish a new container version, a good practice would be to test it with Lighthouse and webpagetest.org. Web Page Test allows you to also throttle the connection speed, therefore, try to test not only fast connections but also slow.
#7. Always try to keep your container lean and remove unnecessary items
It is always a good practice to keep the container as lean as possible and remove all unnecessary items. If you find an irrelevant item (e.g., a tag), just remove it. Even if its impact on speed is very minimal, it’s always better to stay as small as possible. This will also make the management of tags easier in GTM’s interface.
Go talk with your colleagues and ask whether X or Y vendor is still in use. If not, remove their tags from your setup.
Maybe you have some, triggers or variables that are not used anywhere (they just take the space)? In that case, Simo’s gtmtools.com can help to identify them.
Go to gtmtools.com, select the GTM account and container you want to inspect. Then click Visualize > Start Visualization.
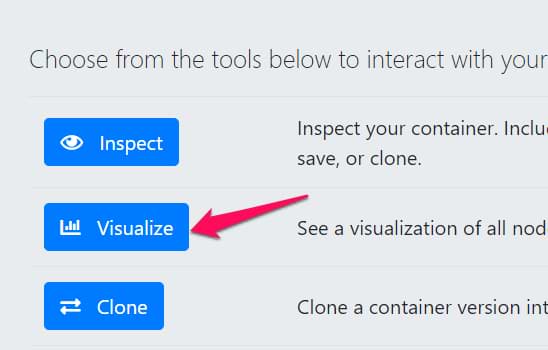
The tool will take all the items in your container and analyze how are they connected. In the middle of the visualization, click Select Hermit Nodes…

…and it will highlight all the items that have no connections, for example:
- Tags that don’t have triggers
- Triggers that are not assigned to any tags
- Variables that are not used in other tags, triggers, or variables
You delete them to free up some space. While this will (probably) not have THAT much of an impact on your page load speed, it will make your work with GTM a bit easier by adding more room to breathe.
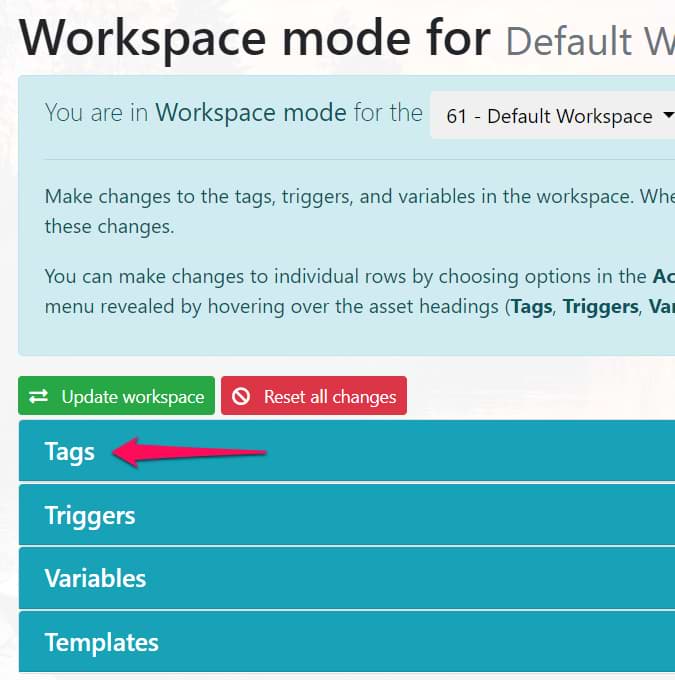
An alternative solution (in that very same gtmtools.com) is this: instead of going to the Visualization mode, go to the Workspace mode and you will see this table. Click on Tags.
And then in the Links column, you will see how many other items (e.g. triggers) are related to it. If that tag does not have relations to ANY other entity in the container, you’ll see a Delete button. Click that button and repeat the same process for all the tags, triggers, and variables.
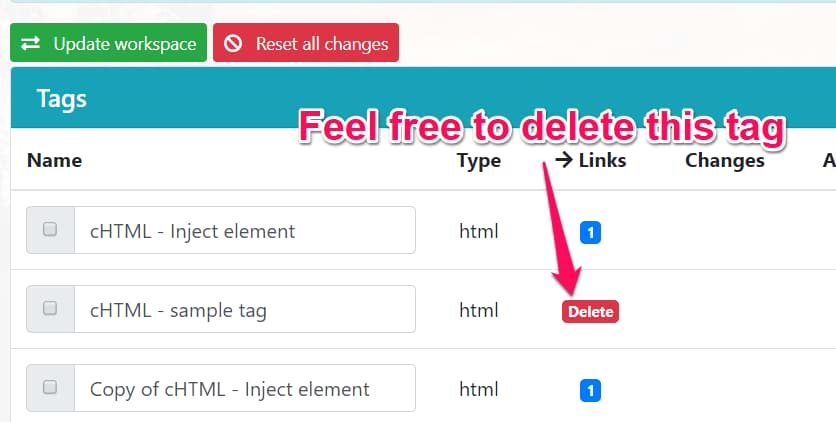
Once you are finished with deleting items, it’s time to push those changes to the container. In the upper left corner of the table, click the green button Update workspace, complete further steps, and done! Your container has just become leaner.
Google Tag Manager vs. Page Speed: Final words
And that’s the end of yet another GTM blog post. While I can’t remember when was the last time I spent so much time on a blog post, at the same time I feel like I have learned so much.
Going back and forth, reading a bunch of resources, trying to digest everything, and then getting some of my prejudice (and biases) adjusted was an invaluable experience. Thanks again to Simo for showing direction at some crossroads I faced.
Here are the key takeaways I would like you to take from this blog post:
- Does Google Tag Manager slow down the site? The most absolute answer is yes. Like any additional line of code added to the site, it will impact the page loading speed. However, the scope of that impact depends on various aspects.
- Although an empty GTM container (added to a site) slightly impacts page loading speed, what matters is what you put inside of it.
- Every setup is different, and different offenders might negatively impact your page speed.
- Asynchronous requests are also impacting page performance. Even though they don’t block the rendering of a page, they still require computer resources that might slow down the overall loading process. The most common offenders are tracking tags you implement on a site (e.g., FB pixel, Twitter tag, or even GA).
- In my experiments, tracking codes added via GTM performed better vs. hardcoded tags (I mean that page loading metrics were better). But according to Simo, this is not categorically true in all cases.
- If possible, delay at least some of your tags. Instead of activating them on All Pages (a.k.a. Page View), move them to Window Loaded or even after that. This is important because there might be some page components that load only after other resources are ready (e.g. scripts). With tracking tags, that “ready” moment is postponed, which means that some important website functionality starts working later than it should.
- Also, DOM manipulations (when you edit, remove, and create items) are quite expensive operations (more expensive than trying to read the value of an existing element).
- Server-side tracking will reduce the heavy lift that browsers have currently to deal with #waitingForThatNewFeatureFromGTM
- It’s all about compromises and sacrifices. There must be a balanced consensus in the organization. Before adding any new tracking functionality, the team/organization should weigh the pros and cons. Yes, that setup will probably affect the page loading speed. But maybe it will have a great benefit for the business, and in the bottom line, the revenue will be increased. Or maybe something else can be removed/paused to compensate for the impact on performance?
- Don’t blindly chase the perfect page speed score. Better keep the business priorities in mind and try to balance them. Speaking of perfect scores, here’s an example of a website with a score of 100:
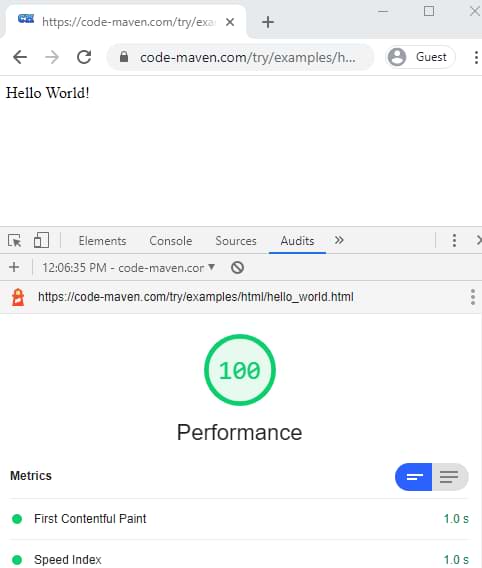

The only thing that is on that page is the text Hello World. No tracking codes, no JavaScript, nothing else. Perfect score? Yes. Will this website earn money? No. I know I’m going here for extremes, but if, for example, some JavaScript is added to a site that allows measuring the efficiency of ads and then reallocating budget to best performers, hence increasing revenue/profit (but negatively impacting page speed), I think that is fair trade (as long as the business is meeting its goal, revenue). - Don’t be greedy and careless. Do you really need 15 tracking vendors implemented on a site? Do you really need that big-ass Custom JavaScript code (you found online) implemented on a site? Have you shown that code to a developer? (it might break things you are not even aware of).
- Test your setup’s speed more than once in a lifetime 🙂 Don’t do that only when the IT department is raising red flags. Do that occasionally to stay lean. Page speed test after every change to the container would be perfect, but doing that at least after major changes would be good enough.
If you have some insights to share from your experience, I’d love to hear them. I have already learned a ton by writing this guide. Would love to learn even more.
38 COMMENTS
Great article Julius. What do you think about loading tags on scroll instead of waiting some seconds after window loaded?
The main thing that I've learned after writing this guide is you should try things yourself and see if there's an improvement (and try to avoid biases).
I would personally stay with the delay after window loaded. The default scroll trigger settings enable the trigger only on Window Loaded, therefore, (I think) you will not win a lot with your suggestion.
But once again, you should try and see (also, not every visitor will scroll on your page, therefore, you will not track them with scroll trigger. Try sending two non-interaction events to GA (one on afterLoad, one on scroll) and see what happens (regarding data accuracy).
I see your point.
I was testing on scroll activation for Hotjar (in my experience, expecially demanding in terms on resources) or other tags where I’m not trying to capture 100% of visitors. I will try the 1.5 window loaded method tho.
Thanks so much for this blog, as mentioned earlier in the intermediate FB group we are currently looking at this for our new webshop.
As always your blogs are a great source for actionable insights!
Glad to be helpful and thanks for reading/watching my content!
Hello Julius,
Thank you for all your effort and time you put into these gtm posts. I just wanna know if ur experiment included preconnecting - dns prefetch googletagmanager.com and if these make any impact in performance at all.
Thanks again.
Hi, my experiments did not touch this point, therefore, it's hard for me to comment on the impact.
Can I get the same effect from pausing a tag as deleting a tag? I always like to pause for a bit to see if there are any unanticipated consequences before I delete the tag.
Thanks! Great article.
Pausing will have very very close effect as it was by deleting a tag. If I recall correctly, the paused tagbis still loaded it the container but that code is not executed, therefore, almost no additional load.
Paused tags are excluded from the container entirely, so they reduce the container weight. In Preview mode, just the name and type of the paused tag is included, so that Preview mode can show that the tag is paused.
Gotcha. I think that the information you mentioned is not only for the preview mode..I remember using gtmspy.com recently and seeing the paused tag in the generated report. It was just displayed as "paused tag" and that's it.
Yeah, that's right. Paused tags do include the minimum data of tag ID and tag type. Name is only available in Preview mode.
Thank you for this clarification.
Yep, I confirm the pause Tag are not published, so they are completely excluded on the container weight. If you "spy" the GTM you cannot see the paused Tag.
I'm sure because I check it when I developed the Project Andromeda.
Great article Julius!
You can see (I mean, see the fact that a tag is paused in the container but without a content) :) This is the screenshot from gtmspy.
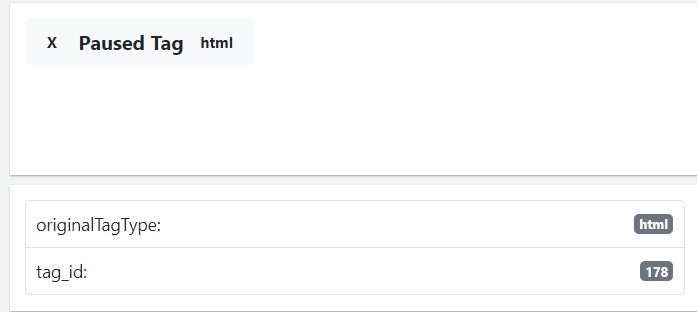

But in the end, yes, it's impossible to see what's inside that tag.
I see only now your reply (sorry for the delay).
Yep, there are only tag id, type of tag, and "paused" status but not the content.
Hi Julius! Awsome article!
You've checked impact of tags. What do you think about impact of JS variables? Intuitively I would say, that the negative impact on page load is possible - there is also a code which has to be executed. What is your opinion? Maybe it's an idea for another test?
PS
I think i.e. about such variables:
https://www.simoahava.com/gtm-tips/prevent-repeat-transactions/
Every added code introduces some sort of load (even if it is almost invisible) but the impact depends on what those variables do.
This is my rule of thumb:
- If it is possible to achieve a certain task with a built-in GTM variable functionality (e.g. parse the part of the URL or get the cookie, or whatever), always go with that built-in functionality (rather than creating custom JS variables). But even in such situations, I can apply exceptions.
- But in some cases (e.g. "prevent duplicate transactions"), you just have to go with Custom JS. And in this case, I'd much rather have a teeny tiny delay in page load speed than duplicate transactions in reports.
So in the end, test your setup with and without certain Custom JS variables and see whether there is an improvement.
So, I'd add that this is another reason to delete (historic) variables that are not used in any tags.
A related question: If I have a lot of tags that fire only on one or two specific pages (as determined by triggers which look for only certain pages), am I still carrying the possible load on EVERY page, because they have to be there in case they're triggered?
When I look at the preview mode, there are a lot of tags that never fire on the home page but which are still there under "Tags Not Fired On This Page." Are they adding to the overhead? Any way to have them only available "for consideration" on the pages that they will fire on, and be invisible on all others?
I'd say that you are overthinking this :) I think that their impact is minimal and there are more important areas to improve, like not fire certain tags or delay them.
Good article Julius! We just implemented the afterLoad trigger and fire the Facebook pageview pixel and a couple of other pixels that took a few seconds (in total) to load but when we tested the page via GTM Metrics (a few times) the page load actually increased from 7s to 11s. When I analyzed the waterfall of requests, I saw the tags which we moved to afterLoad still loading in the waterfall but just loading them at a later time, thus increasing the overall page load time.
Have you tested your site or other sites where you implemented the afterLoad event and what changes did you saw? Dis the speed increased or decreased?
I do not know what ia GTM metrics. You are probably referring to GTmetrix.
I don't know how they calculate page loading time. You. Can try delaying the afterLoad event even more and see if that improves. All in all, this entire process requires tweaking. You try various things and see what improves your situation the most.
using this in combination with Cookie bot Triggers, for example my Facebook pixel will only fire if the DLV cookie bot marketing is present.. But I would also like to use the afterLoad event. How can I combine these events in one trigger?
I am guessing trigger groups can solve this? https://www.simoahava.com/analytics/trigger-groups-google-tag-manager/
This is a great article. Super thorough and addresses so many questions that were on my mind about GTM.
I'm a developer so obviously I am biased toward performance...but could there be a case made for not even calling GTM until the DOM is ready (or later)? It bothers me that there's a 45k script being called in the of my documents, and loading before many of my page's critical resources.
The sooner GTM is fired, the more accurate data will be. Delaying a GA tag to DOM ready will cause some data loss. Not a big loss, but still loss.
But it's all about compromises within a company. I'd rather have a tag fire at dom ready rather than not have GTM access at all.
"Assign this afterLoad Custom Event triggers to those tags that you are willing to delay for 1.5 seconds after the Window Loaded."
This went a bit too fast for me. I can add a trigger (to say Cookie Consent) but then the system shows "or" in between the two triggers. Isn't it the idea that it should be the first trigger (and therefore delay)?
If you want to combine cookie consent trigger with the afterload, use trigger groups.
Hi Analysts!
As always, thanks for such extended and detailed article Julius.
In practical terms, I see afterLoad event useful to replace All Pages trigger like FB Pixel.
But, isn't 1,5 seconds too little time? I mean, what's the point on retargeting those who spend less than 2 secs on the page?
Of course FB wants as much cookies as possible, but in terms of analytics efficiency, I'm not sure where to set the threshold. 1,5? 3? maybe 5 secs??
Thks!!
That was a proof of concept. This is up to you to decide.
Hi, thanks for your amazing post :)
I have a question:
How do you #3. fire some tags only on certain pages? as far as I know when you set a tag, you can't select just some pages...
Yes, you can. This is the fundamental functionality of GTM.
In your trigger, add an additional functionality "page URL" contains xxxxxx
Hi,
great article. I am just looking into this and I found this article:
https://constantsolutions.dk/2020/06/delay-loading-of-google-analytics-google-tag-manager-script-for-better-pagespeed-score-and-initial-load/
where basically you delay WHOLE GTM or every tag in GTM within rules in GTM.
What do you think about it?
Its based on these triggers:
- 3500 milliseconds after document has fired its DOMContentLoaded event
- When user scrolls the page (PageSpeed test does not trigger scroll/click/mousemove events)
- When user moves the mouse on the page
- When user touches anywhere on the page (for mobile devices)
which should ensure that you have more or less accurate Analytics since to leave the page you need to move the mouse etc.
this comment is just to receive notification
Not a fan of that. It takes away a lot of control. Instead, I can delay the tags inside GTM to achieve the same result. But the most critical tags would still be firing as soon as possible.
But everything here is a matter of compromise.
If delaying the entire container is the only way to get it implemented, it's better than nothing.
Good article and well explained! But isn't the hosting playing a huge role here? Just wonder... if has anything to do with the hosting as well... Kind Regards
Hosting of what?