CRO Analytics: How Analytics Helps You Ace Your CRO Game (With Examples)
Google Analytics (GA) is an essential tool for Conversion Rate Optimization as it offers gold-standard data and customer insights that help businesses optimize their websites for better conversions.
If you want to think like a CRO analyst and make critical data-backed decisions for your CRO program, it’s imperative to have a basic understanding of some crucial aspects of analytics and how its marriage with a set of essential CRO tools can shoot up your conversions.
Download Free: Conversion Rate Optimization Guide
Let’s set the foundation of your analytics and CRO journey by discussing the first and foremost aspect of it—CRO goals.
Tracking goals: Macro and micro conversions
Revenue-generating metrics, such as purchases on an eCommerce site, or sign-ups for a demo on a product website, typically bring in money and have been deemed as priority metrics, also known as macro metrics. Besides these, seasoned CRO practitioners recommend tracking auxiliary metrics that push a buyer to make a purchase or sign-up for a demo. These metrics are called micro conversions.
Practice brevity when it comes to deciding your macro conversions. The more macro conversion goals you have, the less specific you become. It’s a good practice to have no more than two macro conversions, so you can track them effectively and take subsequent decisions based on data and insights to maximize on them. For example, SaaS companies have a maximum of two macro conversion goals—free trial and demo request.
On the other hand, you can track as many micro-conversion goals as critical on your buyer’s journey to accomplish your main macro conversion goal. Newsletter subscriptions, eBook downloads, engagement on specific pages, adding products to cart, etc., are some examples of micro conversion goals. Identify the metrics that move the needle by consistently running A/B tests and keep them rolling until you find the profitable ones.

There are four critical types of goals that you can track in GA: URLs, duration, pages/visit, and events. You have to set up your goals in your GA account and start collecting data.
How to leverage insights from Google Analytics report for CRO
Google Analytics has standard preset reports that offer a wealth of insights into data on every nook and corner of your website. However, GA can only tell you about what is happening on the website.
To dive deeper into the ‘whys’ of any particular data that GA collects around dimensions, metrics, events, etc., you must consider supporting CRO tools that enable you to analyze your visitor behavior for the invaluable insights they hold for your business. Thereby, helping you capitalize on these insights through rigorous testing, without spending money on driving more traffic or waiting for the traffic that converts (the latter is highly ineffective and impractical!).
What are the report types?
Google Analytics has broadly two types of reports—standard reports and custom reports.
Standard reports are preset reports that are further divided into segments such as real-time, audience, acquisition, behavior, and conversions. While custom reports, as the name suggests, are customizable as per the data you need in a single view.
Real-Time Reports
Real-time reports allow you to monitor your site’s activity in real-time. You can utilize these reports to track real-time responses to a campaign, and look for optimization opportunities in specific events, elements, or content that are nailing it.
With the insights gathered from this report, you can utilize tools such as VWO insights to understand the whys around the GA-collected data in an easily comprehensible manner. You can run an A/B test on your campaigns launched at different times to maximize conversions with experimentation and data supporting your hypothesis.
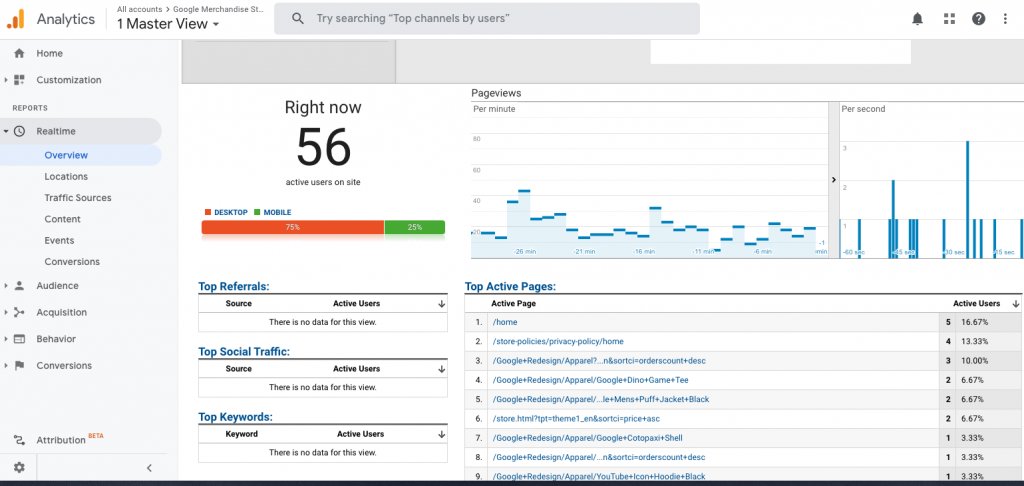
Real-time reports are broadly divided into six segments:
- Overview: Offers you data of active users on your website.
- Locations: This segment shows where in the world your visitors are accessing your website. You can apply filters for granular data such as their city and exact location.
- Traffic: The data you see in the traffic segment is organized by source, medium, and the number of active users.
- Content: The data you see in the traffic segment is organized by source, medium, and the number of active users.
- Events: This segment shows you the top custom events in real-time, such as ad clicks, video plays, clicks, etc. You can look at the non-real-time data in the behavior reports discussed in the following sections.
- Conversions: The conversion report shows you conversions accomplished in real-time for any goals you have set in your GA. You can view on which device users are converting more.
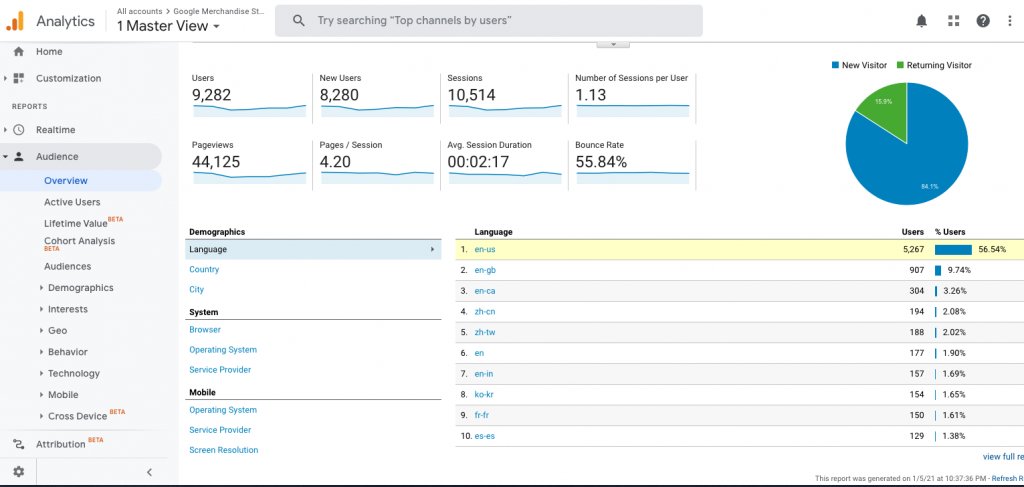
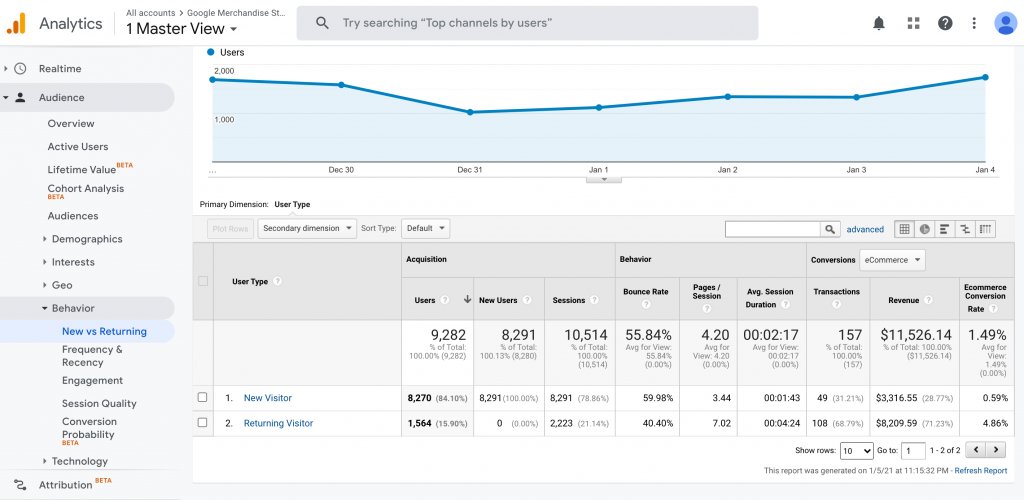
Audience
As the name suggests, audience reports drill down crucial data of your audience. This data is not real-time data but shows you a useful snapshot of your audience in its overview section. The segments are divided into 15 sections, namely, overview, active users, lifetime value, cohort analysis, audiences’ demographics, interests, geo, behavior, technology, mobile, cross-device, custom, benchmarking, and user flow.
This section in GA is a gold mine of audience insights. But to understand what these data indicate, you must invest in an industry-standard visitor behavior analysis CRO tool like VWO Insights.
For example, suppose you know that conversions of new visitors are sub-par compared to the returning visitors or loyal customers on your website. In that case, you must look into a CRO opportunity to convert better by understanding the new visitor’s behavior on your site.
You can utilize heatmaps, session recordings, and run surveys to understand your users’ hesitations when they visit your website for the first time.
Acquisition
Acquisition reports in GA give you insights into the user’s path to reach your website. This report, as shown below, is the overview that summarizes critical data about how the users landed on your website.
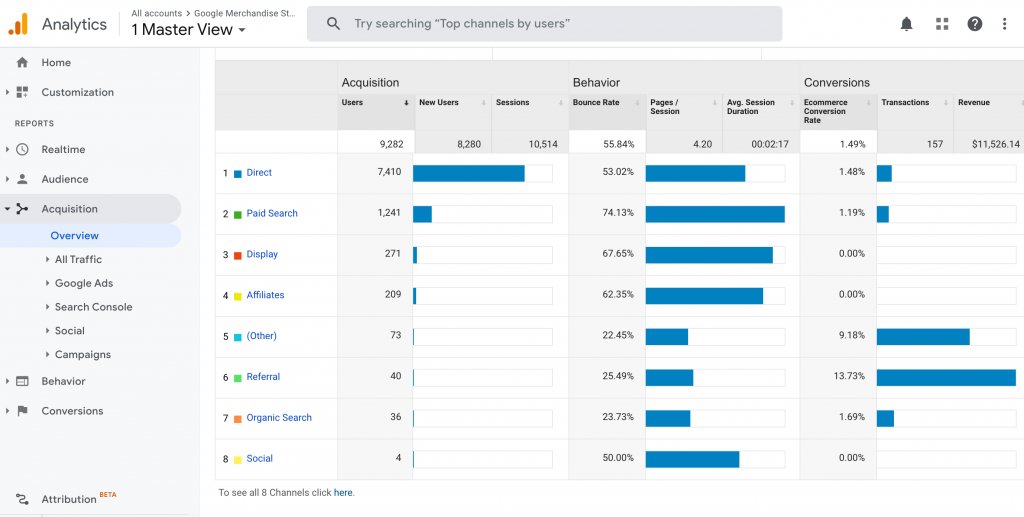
It shows you the total visits of the site and the number of users, new users, and sessions as metrics against acquisition dimensions, such as direct, paid, display, affiliates, referral, etc.
These reports are divided into six segments: Overview, All traffic, Google Ads, Search Consoles, Social, Campaign.
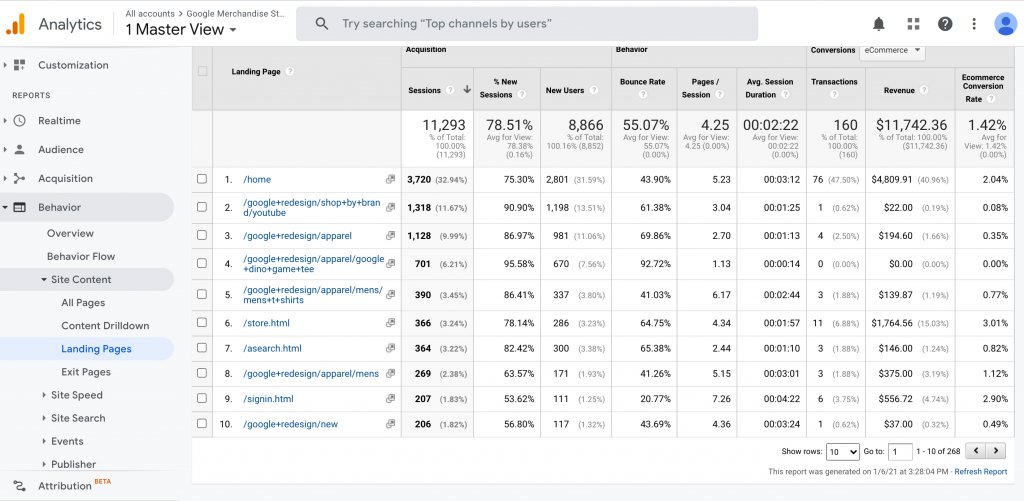
Using your social landing page reports, you can identify which social channels are bringing you traffic. These data show you the URL, sessions, page views, and session duration, as shown below.
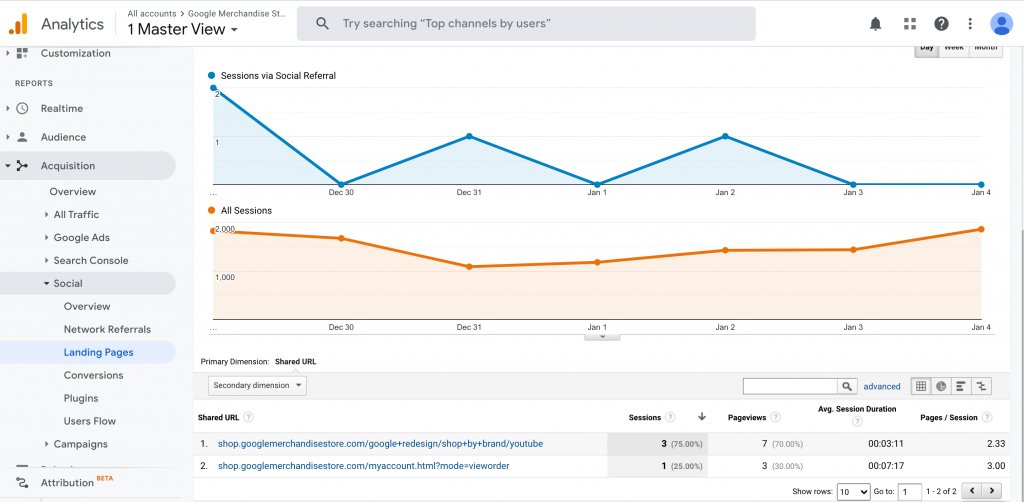
You can make an informed, data-backed decision by looking at the most shared landing page’s heatmaps and gauge user behavior after they land on your page.
AssessmentDay, which deals with a supply business of aptitude tests to graduates and job seekers, ran an A/B split URL test on their co-branded landing page for optimizing the website content. The acquisition data suggested that they were driving most of the traffic from the affiliate website. They ran back to back A/B tests on their high-traffic landing page and observed a 65% improvement in the conversions.
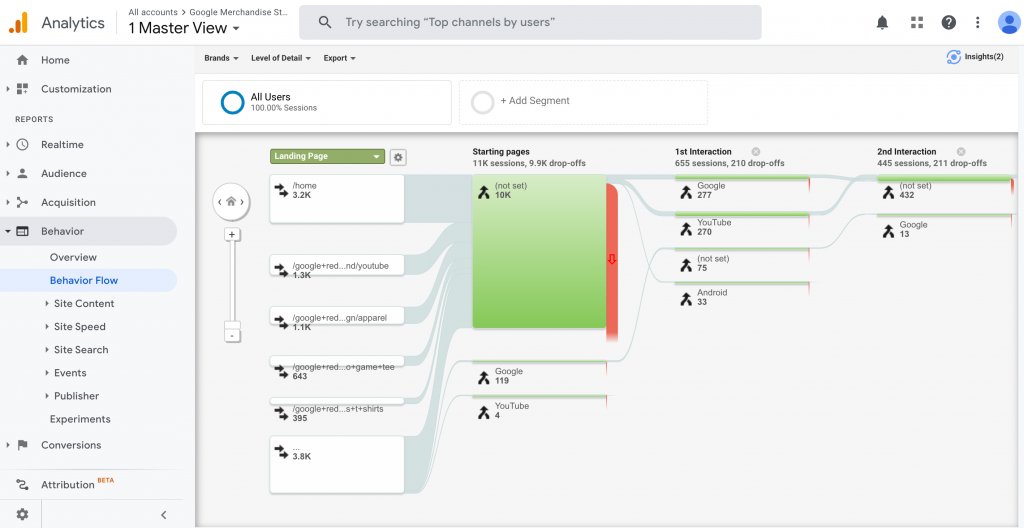
Behavior
Google Analytics’s behavior report shows you how website visitors navigate your website and interact with your content. The behavior report is further broken down into eight segments: overview, behavioral flow, site content, site speed, site search, events, publisher, and experiments.
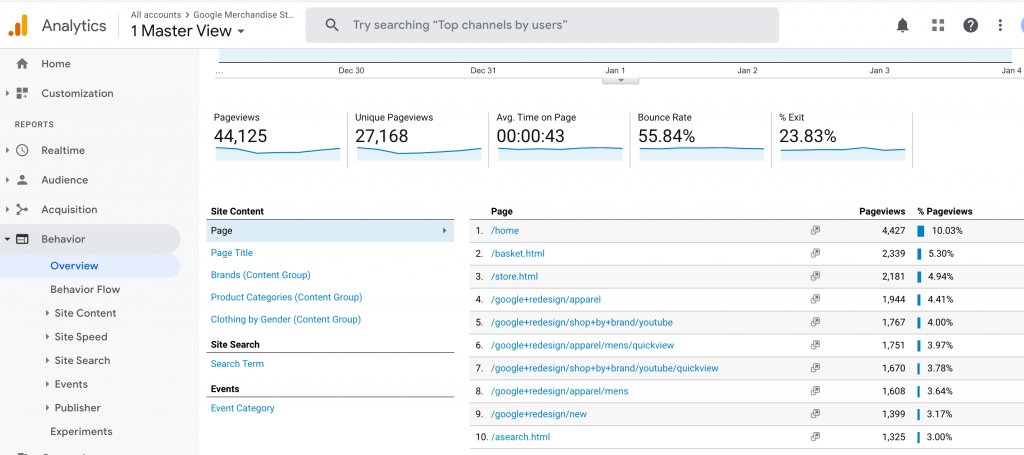
This report offers ample opportunity for optimization. For example, using this report, you can identify where your visitors feel disengaged enough to drop off in the funnel during their journey. Utilize heatmaps and on-page surveys to know why they are dropping off and optimize the website elements for better conversions.
Conversions
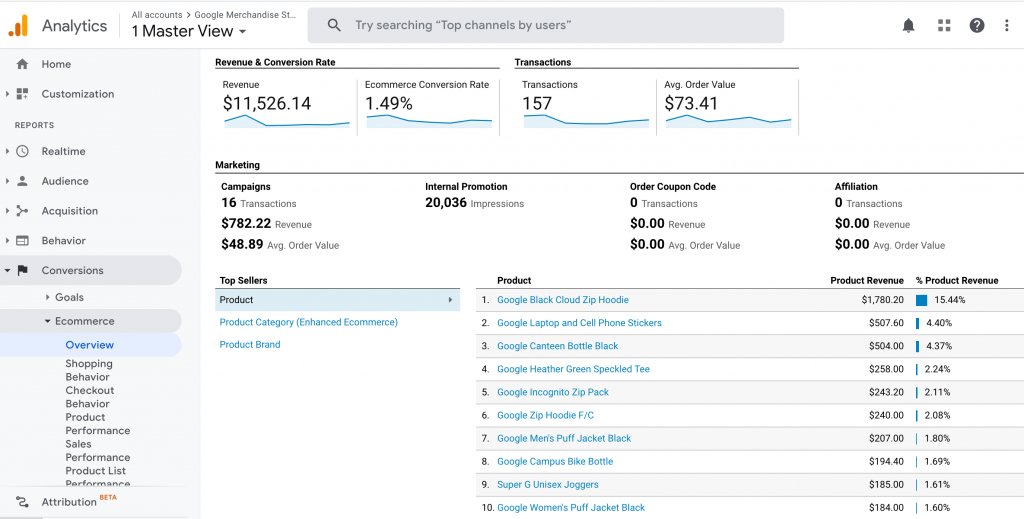
Based on the type of business you do online, conversions (macro conversions) fall into two categories—sale or leads. In Google Analytics, conversion reports are divided into three segments: goals, eCommerce, and multi-channel funnels.
Utilizing the eCommerce report, which shows you the most popular sold products (top sellers) and the revenue they have generated, you assess the opportunities to improve the current conversion rate using effective CRO tools. Deep dive into the data you have collected in GA, generate ideas, and test which one works best for you.
For example, if an item of specific clothing is driving more conversions, you can drill down more about the product to see how users are behaving on this product page. Are there drop-offs? Are they abandoning the cart? If they are landing on your page, they have a huge intent to buy.
You can optimize a metric like cart abandonment through running a cart abandonment campaign to improve your metrics. CRO tools such as VWO Insights that offer session recordings and on-page surveys enable you to observe the visitor behavior.
Download Free: Conversion Rate Optimization Guide
Five reports that can help you achieve your desired conversion rates
1. Landing Page Performance report:
Find this behavior report under site content. This report is essential in every CRO analyst’s conversion toolbox. The insights you find here can easily be translated into conversions as it identifies non-performing pages that need to be worked upon. But here’s a catch! GA data can help you only ‘identify’ these pages. What good or bad went in hindsight needs to be looked at as well, if you want to optimize your website for better conversions. And that’s what CRO tools are here for.
2. Behavioral data by content post:
This report can be found under site content’s all pages segment. This gives you an insight into which blog post is bringing you lots of traffic that is not converting. You can create an advanced segment in this report to see how your blog posts contribute to the business revenue goals.
Create an advanced segment to procure this information by following the below steps:
- Copy the URL of the page you want to analyze.
- Click +Add Segment
- Find “Conditions” and “Sequences” on the left-hand side of the panel.
- Set up “Sequence” as “STEP 1” for the page to be analyzed.
- Set up “STEP 2” with transactions per user greater than 0.
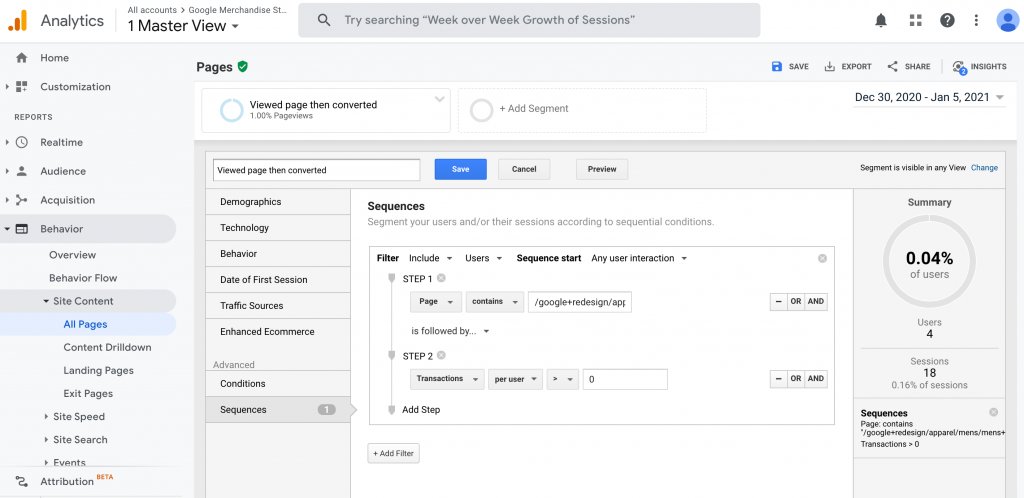
With all the traffic you have on your site, it presents ample opportunity for improving your conversions to you as a CRO person. Using tools like VWO insights, which is an easy to understand and visually interactive tool, you can deduce why your non-converting visitors are behaving in a certain way on your blog post. It could be because of a broken CTA on your landing page you are not paying attention to or they seem non-engaged because of lack of any visual media or may be too many spam-like visuals! But these are just hypotheses you must test before jumping to fix them following your gut instinct.
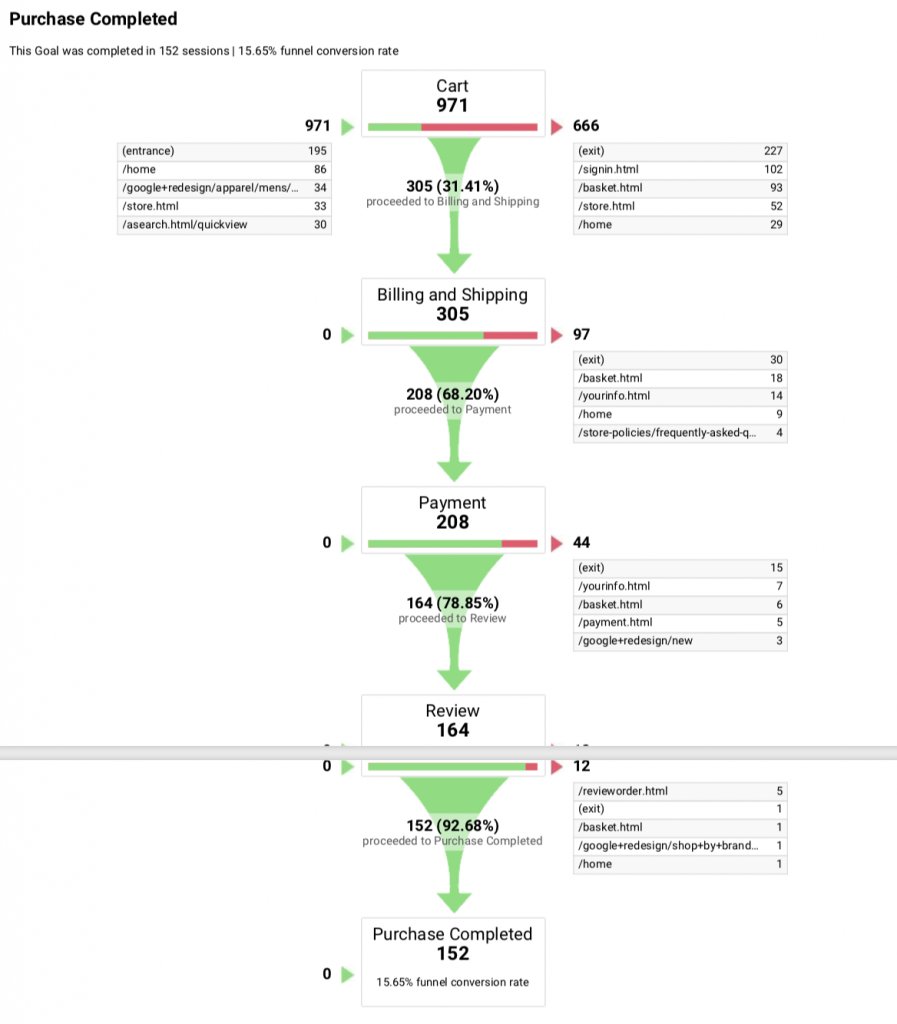
3. Goal funnel visualization:
This is one of the crucial conversion reports that GA offers you for your CRO program. You can analyze how much traffic is dropping off at each step of your conversion funnel. To understand and analyze why this traffic behaves in a certain manner, CRO tools such as VWO insight’s Funnels empower you to make data-based decisions to optimize broken elements of your funnel. Find this report under Conversions > Goals > Funnel visualization.
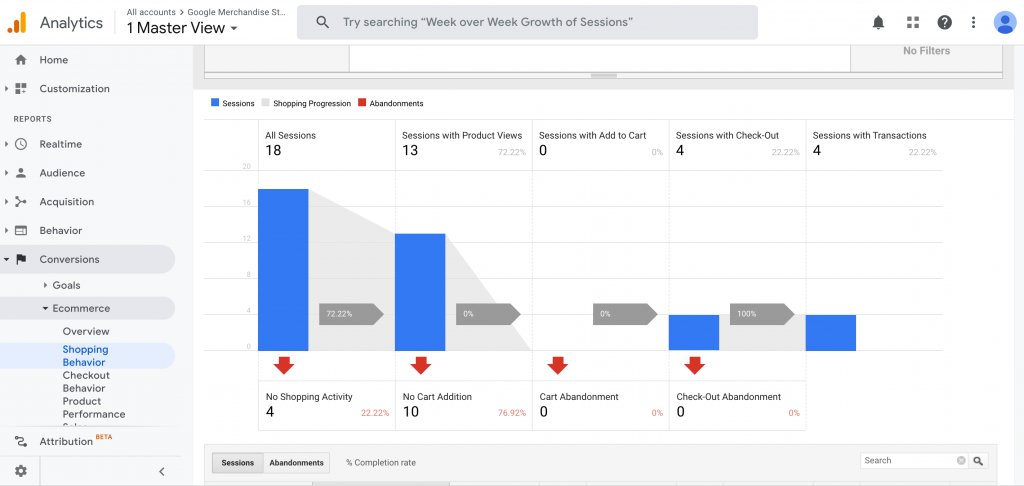
4. Horizontal funnels report:
If you have an enhanced eCommerce set up, look for these horizontal funnels under Conversions > eCommerce > Shopping Behavior. You can leverage many data-backed insights for CRO across multiple dimensions such as city, devices, browsers, etc., using essential CRO tools like VWO Funnels. Before implementing these insights, just A/B test them!
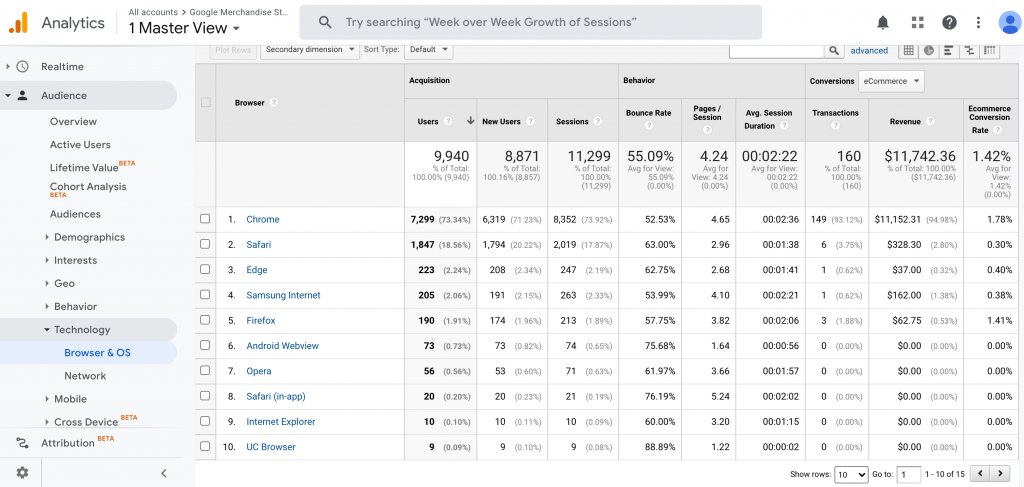
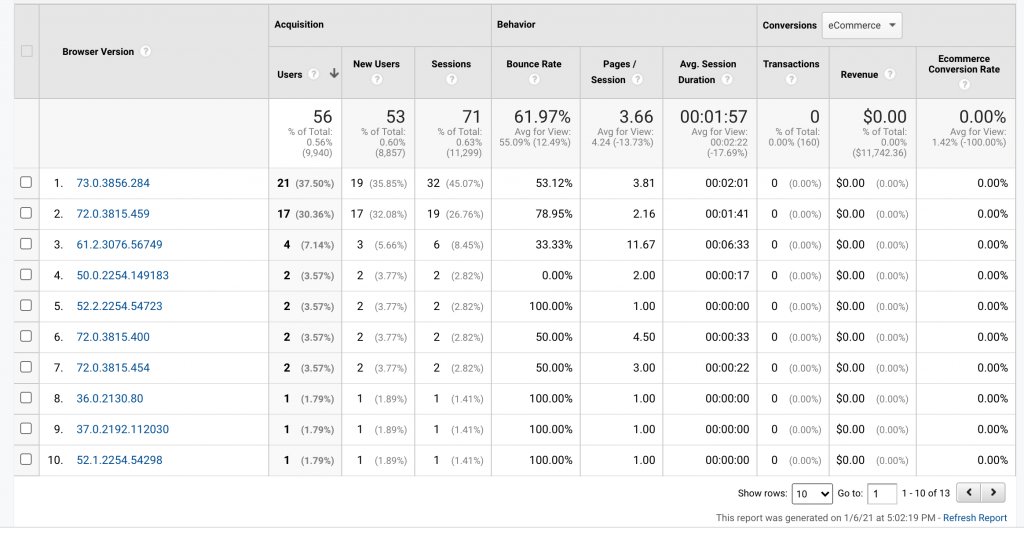
5. Conversion by browser and OS
Browser reports and device reports are great to look at for easy insights that can fetch you conversions with the right set of CRO tools. Looking at these data, you can figure out which browser is not driving substantial conversions, and then you can drill down further by clicking on the same to see which version is impacting the overall conversion rate.
How to set up GA reports in your CRO tool
You can set up these reports by integrating GA in your experimentation tools like VWO to make the most out of your CRO efforts.
For example, if you are optimizing content on your landing page, integrating VWO with GA will allow you to view your website data in GA for the variations you create for the test. You can also filter data based on the metrics that you define in GA.
You will need to:
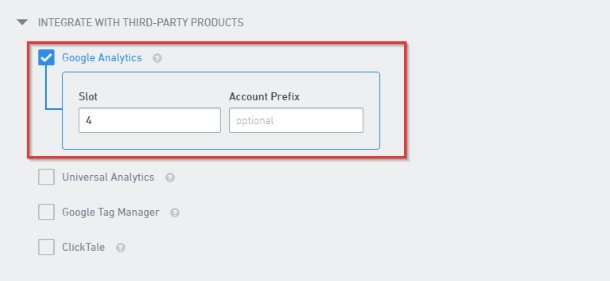
- Enable GA integration in VWO: VWO offers A/B testing features. You can set it up for a new test by following these steps:
You can also integrate GA for your existing tests by logging into your VWO account and choosing the test you want to work with.
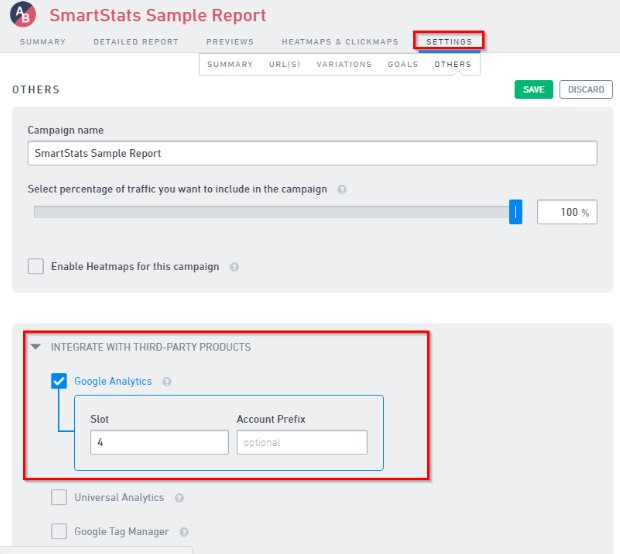
If you are using more than one GA account, you can enter the Account Prefix you want to integrate with VWO. You must leave the field empty if you are using a single account.
- Create custom reports: Custom variable slots are used for visitor information. VWO-GA integration uses these slots to send information related to the tests, variations that your visitors access. You can find the setup instructions here.
Conclusion
A thorough understanding of analytics reports and GA integration with effective CRO tools is the fundamental recipe to succeed at your CRO game, but with patience. With tools like behavior analysis and A/B testing, you will be able to hit a treasure trove of insights with all the data you have collected, which in turn will generate actionable, tried and tested ideas (quite literally!) for driving conversions that put money in your pocket.

Categories: